Continuous polymerization requires control over both reaction conditions and the polymer properties developed inside the reactor. Molecular weight, molecular weight distribution and rheological behavior influence product consistency, downstream processing and final material performance.
Online viscosity monitoring in polymerization provides frequent information about changes in process rheology. However, process viscosity is not a direct measurement of molecular weight. Temperature, polymer concentration, solvent composition and shear conditions can all change the measured value without an equivalent change in polymer chain length.
A reliable monitoring strategy therefore combines inline viscometry with suitable analytical methods and validated estimation models. Depending on the required information, these methods may include intrinsic viscosity measurement, Automatic Continuous Online Monitoring of Polymerization (ACOMP), gel permeation chromatography (GPC) and model-based estimation.
The engineering challenge is to connect these measurements with reactor behavior, product specifications and process control requirements. This requires appropriate sampling arrangements, analytical validation and integration with the continuous production system.
Why Online Monitoring Matters in Continuous Polymerization
In a continuous polymerization reactor, reactants enter while polymer products leave at controlled rates. Changes in feed composition, reaction temperature or residence time can affect conversion and polymer properties throughout production.
Molecular weight is particularly important because it influences chain entanglement, solution behavior, melt viscosity and mechanical properties. Molecular weight distribution also affects processing behavior, even when average molecular weight remains relatively stable.
Limitations of Offline Polymer Characterization
Conventional laboratory methods, including GPC/SEC and intrinsic viscosity analysis, provide important reference measurements. However, sample collection, preparation and analysis introduce delays between a process change and the availability of analytical results.
A laboratory measurement also represents a specific sampling point rather than continuous changes inside the reactor. If reaction conditions drift between sampling intervals, the production system may continue generating off-specification material before operators identify the deviation.
Online measurements address this gap by providing more frequent process information. Their main value lies in detecting changes earlier and supplying data for process interpretation, rather than replacing laboratory characterization entirely.
How Viscosity Relates to Polymer Molecular Weight
Polymer viscosity depends on molecular weight, concentration, molecular architecture and measurement conditions. The relationship differs between dilute solutions, concentrated polymer solutions and polymer melts.
In dilute solutions, individual polymer chains contribute to hydrodynamic resistance through their molecular size and interactions with the solvent. As concentration increases, polymer coils overlap and eventually become entangled, producing a more complex relationship between concentration and viscosity.
Polymer melts exhibit different behavior because solvent effects are absent and chain entanglement becomes important in determining flow resistance.
| Variable | Effect on measured viscosity |
|---|---|
| Molecular weight | Influences chain dimensions and entanglement |
| Polymer concentration | Changes chain overlap and intermolecular interactions |
| Temperature | Changes molecular mobility and fluid resistance |
| Shear rate | Affects apparent viscosity in non-Newtonian systems |
| Solvent composition | Changes polymer-solvent interactions |
| Molecular architecture | Branching and chain structure influence hydrodynamic behavior |
Consequently, an increase in process viscosity does not necessarily indicate an increase in molecular weight. Engineers must account for the other variables before using viscosity measurements to estimate polymer properties.
The Mark-Houwink-Sakurada Equation
Intrinsic viscosity provides a quantitative relationship between polymer solution behavior and molecular weight.
The Mark-Houwink-Sakurada equation is
[[\eta]=K M_v^\alpha]
Where
- ([\eta]) is intrinsic viscosity.
- (K) is a polymer-solvent-temperature-specific constant.
- (M_v) is viscosity-average molecular weight.
- (\alpha) is an empirical exponent describing polymer solution behavior.
Rearranging the equation gives
[M_v=\left(\frac{[\eta]}{K}\right)^{1/\alpha}]
The constants (K) and (\alpha) depend on polymer chemistry, solvent and temperature. Parameters established for one polymer-solvent system should not automatically be transferred to another.
An important distinction is that the equation directly relates intrinsic viscosity to viscosity-average molecular weight, not weight-average molecular weight ((M_w)).
Estimating (M_w) requires an additional relationship accounting for the molecular weight distribution. An experimentally validated correlation may provide a practical approximation in a specific polymerization system, but it should not be treated as a universal conversion between (M_v) and (M_w).
Why Process Viscosity Is Not a Direct Molecular Weight Measurement
Process viscometers measure fluid resistance under actual operating conditions. Intrinsic viscosity, by contrast, is a dilute-solution property that characterizes the hydrodynamic contribution of polymer molecules as solution concentration approaches zero.
An inline viscometer may report apparent viscosity influenced by temperature, concentration, shear rate and fluid composition. Converting this measurement into molecular weight requires a correlation validated for the actual polymerization system.
For example, increasing monomer conversion may raise polymer concentration and process viscosity even when molecular weight distribution changes relatively little. A temperature decrease can also increase viscosity without a corresponding increase in chain length.
Perry’s Chemical Engineers’ Handbook emphasizes that rheological measurements require well-characterized flows. In continuous polymerization, this means that measurement conditions and shear history must be controlled before viscosity trends are compared or interpreted.
Online Monitoring Technologies for Continuous Polymerization
The main monitoring technologies differ in what they measure and how directly they provide molecular weight information. Selection should depend on whether the process requires viscosity tracking, average molecular weight estimation, molecular weight distribution analysis or feedback control.
Inline and Online Viscometers
Inline viscometers measure process fluid viscosity continuously or at frequent intervals without requiring every measurement to be performed in an external laboratory.
Common measurement approaches include
- Vibrational and resonant viscometers.
- Capillary viscometers.
- Rotational viscometers.
- Piston-based measurement systems.
- Process rheometers for polymer melts.
Vibrational instruments evaluate changes in the behavior of an oscillating sensing element caused by fluid resistance. Capillary instruments relate pressure drop and flow behavior under defined conditions, while rotational instruments measure resistance to controlled mechanical movement.
The measurement principle must match the polymer system. High-viscosity polymer streams may require different installation, cleaning and flow arrangements from low-viscosity solution polymerization systems.
Engineers should also distinguish dynamic viscosity from apparent viscosity. For non-Newtonian fluids, measurements obtained at different shear rates may not be directly comparable.
An inline viscometer is therefore most useful when its measurement conditions are defined and its output is interpreted alongside temperature, concentration and other relevant process variables.
Online Intrinsic Viscosity Estimation by Capillary Flow-Time Measurement
Conventional intrinsic viscosity determination generally involves measuring polymer solutions at multiple concentrations and extrapolating the results toward zero concentration. This procedure can be difficult to integrate into continuous production because it requires repeated measurements and controlled sample preparation.
A 2001 study by Vega, Lima and Pinto investigated a simplified approach for peroxide-initiated styrene solution polymerization.
The method estimated approximate intrinsic viscosity using a single flow-time measurement of a diluted polymer solution passing through a capillary tube.
The measurement sequence was
- Extract a representative polymer solution sample.
- Dilute the sample to a controlled concentration.
- Pass the diluted solution through a capillary tube.
- Measure its flow time.
- Estimate approximate intrinsic viscosity using the established analytical relationship.
- Apply a validated molecular weight correlation.
The approach reduces the number of measurements required compared with conventional multi-concentration intrinsic viscosity determination.
However, the study investigated a specific styrene solution polymerization system in a tubular reactor. Its method should not be treated as a universal replacement for laboratory intrinsic viscosity analysis.
Industrial implementation requires reproducible dilution, controlled temperature, capillary cleanliness and stable flow-time measurement. The relationship between the estimated intrinsic viscosity and the target molecular weight average must also be validated.
ACOMP for Continuous Polymerization Monitoring
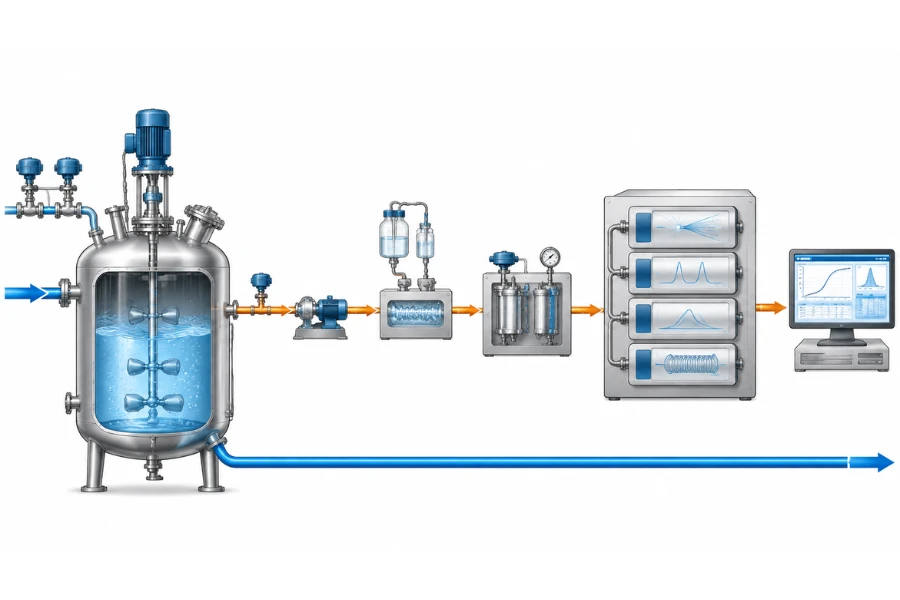
Automatic Continuous Online Monitoring of Polymerization (ACOMP) is a multi-detector analytical platform that monitors polymerization through continuous sampling, dilution and analysis.
Unlike a conventional inline viscometer, ACOMP generally extracts a small reactor stream and conditions it before passing the sample through selected analytical detectors.
A typical arrangement involves
- Extracting a representative sample from the reactor.
- Diluting the sample to obtain suitable analytical conditions.
- Conditioning the sample when required.
- Passing it through selected detectors.
- Combining measurement signals to evaluate polymer and reaction properties.
Depending on the configuration, detectors may include
| Detector | Analytical contribution |
|---|---|
| Multi-angle static light scattering | Molecular weight and polymer size information |
| Differential refractive index | Polymer concentration and refractive response |
| UV/Vis spectroscopy | Absorbing species and composition-related information |
| Viscometry | Solution viscosity and intrinsic viscosity information |
Suitable combinations of light scattering and concentration detection can provide molecular weight information. Viscometry supports intrinsic viscosity analysis, while other detectors provide information about reaction composition and polymerization behavior.
ACOMP has been investigated in free-radical, controlled-radical and condensation polymerization, as well as micellar and emulsion systems. Applications include batch, semibatch and continuous reactors.
An important distinction is that ACOMP is not inherently a chromatographic technique. Its analytical approach relies on continuously extracting and conditioning samples rather than separating polymer molecules through a chromatographic column.
ACOMP can also be combined with GPC or other separation techniques when more detailed molecular weight distribution information is required.
Its industrial limitations include sample preparation complexity, bypass representativeness, detector calibration and analytical response time. The appropriate configuration depends on the properties that need to be measured and the polymerization chemistry.
Online GPC/SEC for Molecular Weight Distribution
Gel Permeation Chromatography (GPC), also known as Size Exclusion Chromatography (SEC), separates polymer molecules according to their hydrodynamic size in solution. It provides information about molecular weight distribution rather than relying on a single viscosity measurement.
Important molecular weight parameters include
[M_n=\frac{\sum_i N_iM_i}{\sum_i N_i}]
[M_w=\frac{\sum_i N_iM_i^2}{\sum_i N_i}]
And dispersity
[Đ=\frac{M_w}{M_n}]
Where (N_i) represents the number of molecules within a molecular weight fraction and (M_i) represents the molecular weight of that fraction.
Number-average molecular weight is more sensitive to smaller molecules, while weight-average molecular weight gives greater influence to larger molecules. Dispersity describes the breadth of the molecular weight distribution.
Two polymer samples can have similar (M_w) values but different dispersity and distribution profiles. This distinction matters when downstream processing or product specifications depend on distribution shape.
Conventional calibration-based GPC/SEC generally reports molecular weights relative to selected standards. Differences in hydrodynamic volume between the reference standards and the polymer being analyzed can affect the results.
SEC coupled with multi-angle light scattering (SEC-MALS) can provide additional information for absolute molecular weight determination. This generally requires a suitable concentration detector, an appropriate refractive index increment ((dn/dc)) and validated data processing.
Online GPC introduces additional requirements, including automated sampling, dilution, filtration, column protection, detector configuration and chromatogram processing.
A 2025 study by Pointer and colleagues demonstrated the integration of commercial GPC equipment with automated sampling and flow polymerization platforms. The reported conventional GPC acquisition times were approximately 15–45 minutes, depending on the analytical method and column configuration.
High-throughput columns supported selected monitoring intervals of approximately 3–10 minutes, although faster analysis could reduce chromatographic resolution. The study also demonstrated a mixed D column configuration with individual analysis taking less than 15 minutes.
These results illustrate a key engineering trade-off. Faster analysis improves temporal resolution, but the selected column configuration must still provide sufficient separation for the molecular weight information required.
Online GPC is therefore valuable for detailed polymer characterization, but its analytical cycle may make it unsuitable as the sole measurement for fast process feedback.
Soft Sensors and Model-Based Molecular Weight Estimation
Soft sensors estimate difficult-to-measure polymer properties using available process measurements and mathematical models.
Depending on the polymerization system, model inputs may include
- Temperature and pressure.
- Density and conversion.
- Feed flow rates.
- Residence time.
- Polymer concentration.
- Process viscosity.
Mechanistic models describe polymerization kinetics and molecular property development. Empirical models establish relationships between process measurements and laboratory reference results.
State estimation methods, such as the Extended Kalman Filter (EKF), combine model predictions with available measurements to estimate the changing state of a reactor.
A typical development procedure involves collecting representative process data, obtaining corresponding laboratory molecular weight results, fitting the estimation model and validating its predictions against independent samples.
Model inputs must represent the actual polymerization system. A correlation developed for solution polymerization may become unreliable when solvent composition, polymer concentration or reaction conditions change beyond the validated range.
A soft sensor is an estimation method, not an independent molecular weight measurement. Its reliability depends on model structure, measurement quality and validation data.
Comparing Online Monitoring Technologies
| Technology | Primary measurement | Molecular weight information | Main limitation |
|---|---|---|---|
| Inline viscometer | Process viscosity | Indirect estimation | Sensitive to process conditions |
| Capillary viscometry | Solution or intrinsic viscosity | Model-based estimation | Requires controlled sample conditions |
| ACOMP | Multiple analytical signals | Depends on detector configuration | Sample conditioning and calibration |
| Online GPC/SEC | Molecular size distribution | (M_n), (M_w) and dispersity | Analytical cycle and separation resolution |
| Soft sensor | Estimated process properties | Model-dependent estimation | Requires representative validation data |
These methods can complement one another. For example, a production system may use an inline viscometer for frequent measurements, laboratory GPC for reference characterization and a soft sensor to estimate molecular weight between laboratory analyses.
Integrating Monitoring Systems Into Continuous Polymerization Reactors
Measurement reliability depends on more than the analyzer. Sensor placement, sample transport and process integration determine whether analytical data represent the actual reactor conditions.
Sensor Placement and Bypass Sampling Design
Monitoring locations should reflect the process information required.
| Monitoring location | Primary objective |
|---|---|
| Reactor outlet | Evaluate properties of material leaving the reaction zone |
| Between reaction stages | Identify changes during multistage polymerization |
| Process bypass loop | Provide controlled conditions for analytical equipment |
| Downstream process line | Monitor properties before subsequent processing |
A reactor outlet measurement describes the material leaving the reactor, not necessarily the conditions throughout its volume. Mixing limitations and residence time distribution can produce differences between local measurements and overall reactor behavior.
Bypass sampling introduces another source of uncertainty. The extracted stream must represent the main process flow without excessive transport delay or changes in composition.
Key design variables include
- Sample transport time and line volume.
- Bypass flow stability.
- Pressure and temperature control.
- Dilution and sample conditioning.
- Dead volume and residence time.
- Polymer deposition and fouling.
- Cleaning and maintenance access.
High-viscosity solutions may behave differently in narrow sampling lines than in the main reactor. Stagnant regions can cause polymer deposition, while inadequate flow can delay the arrival of representative samples.
The sample may also continue reacting after extraction if reactive species remain active. Depending on the chemistry, controlled dilution, temperature adjustment or another suitable conditioning method may be required to preserve a reproducible analytical state.
Temperature, Pressure and Shear Effects
Temperature is a major source of viscosity variation. A temperature decrease can increase measured viscosity without changing molecular weight.
Shear rate also affects apparent viscosity in non-Newtonian polymer solutions and melts. Measurements obtained under different shear conditions should not be compared without an appropriate correction or validated measurement protocol.
Pressure effects depend on fluid properties, operating conditions and the instrument’s measurement principle.
Perry’s Chemical Engineers’ Handbook identifies the importance of well-characterized flows in rheological measurements. In practical monitoring systems, this requires defined flow conditions and consistent measurement geometry.
Temperature compensation and molecular weight calibration serve different purposes. Temperature compensation corrects for measurement variation, while molecular weight calibration establishes the relationship between a measured property and the target polymer characteristic.
Matching Analytical Response Time With Reactor Dynamics
The complete monitoring response time includes sample transport, conditioning, analysis and data communication.
A practical engineering breakdown is
[
t_{\text{total}} =
t_{\text{transport}}+
t_{\text{conditioning}}+
t_{\text{analysis}}+
t_{\text{communication}}
]
Where
- (t_{\text{transport}}) is the time required to move the sample to the analyzer.
- (t_{\text{conditioning}}) is the time required for dilution and preparation.
- (t_{\text{analysis}}) is the analytical measurement time.
- (t_{\text{communication}}) is the time required for processing and transmitting the result.
Flushing, sample replacement, data filtering and analyzer recovery may also contribute to the effective delay.
A fast viscometer can still provide delayed information if the bypass line has a large internal volume or insufficient flow. Similarly, an online GPC system may provide detailed molecular weight distribution data too slowly for direct control of rapid reactor disturbances.
The monitoring frequency should therefore be selected according to the process dynamics and intended use of the data. Periodic GPC analysis may be sufficient for quality supervision, while faster process deviations may require inline measurements supported by a validated estimation model.
Integration With Industrial Control Systems
Analytical measurements can be integrated with Programmable Logic Controllers (PLCs), Distributed Control Systems (DCS), Supervisory Control and Data Acquisition (SCADA) platforms and industrial data historians.
The data interface should include measurement values and status information, such as instrument alarms, signal validity and communication status.
A sudden viscosity increase should not automatically trigger a feed-rate adjustment if the instrument reports a fault or the measurement falls outside its validated operating range.
Control logic must distinguish genuine polymer property deviations from sampling problems, sensor drift and communication failures.
From Online Measurements to Validated Molecular Weight Estimates
A continuous viscosity signal becomes useful for molecular weight estimation only after the relationship between the measured property and the target molecular weight has been established.
Establishing Viscosity-Molecular Weight Correlations
Correlation development begins with representative polymer samples collected under known process conditions.
A practical procedure involves
- Collecting samples across the expected operating range.
- Recording corresponding online viscosity measurements.
- Measuring molecular weight using a suitable reference method, such as GPC/SEC.
- Recording temperature, concentration and other relevant process variables.
- Developing an empirical or mechanistic correlation.
- Evaluating the model using independent validation samples.
For solution polymerization, intrinsic viscosity can provide a useful basis for estimating viscosity-average molecular weight.
If the production specification requires (M_w), the relationship between (M_v) and (M_w) must also be established. Changes in molecular weight distribution may invalidate an existing correlation even when the polymer chemistry remains unchanged.
Calibration and Model Validation
Four activities must be distinguished during system development.
| Activity | Purpose |
|---|---|
| Instrument calibration | Establish the relationship between instrument response and reference standards |
| Analytical method validation | Confirm that the measurement procedure is suitable |
| Model calibration | Fit model parameters using representative process and laboratory data |
| Model validation | Evaluate predictions using independent data |
Instrument calibration alone cannot demonstrate that a viscometer accurately predicts molecular weight.
The correlation model must also be tested across the expected range of temperature, concentration, feed composition and operating rate. A change in formulation or solvent composition may require additional calibration or model redevelopment.
Managing Measurement Uncertainty
Molecular weight estimation combines uncertainty from several sources.
- Sensor uncertainty arises from instrument drift, fouling, installation conditions and measurement repeatability.
- Sampling uncertainty occurs when the bypass stream does not adequately represent the reactor contents.
- Reference uncertainty depends on the analytical method and sample preparation used to establish molecular weight.
- Model uncertainty increases when predictions are made outside the calibration range.
A reliable monitoring strategy should define its validated operating range, establish criteria for laboratory confirmation and provide procedures for reviewing model performance during long-term operation.
Using Online Monitoring for Continuous Polymerization Process Control
Online measurements can support process control when they are combined with reliable state estimation and an understanding of reaction dynamics.
Detecting Process and Molecular Weight Deviations
An unexpected viscosity increase may result from increasing polymer concentration, molecular weight growth, lower process temperature, changes in solvent composition, branching or microgel formation.
Engineers should evaluate these possibilities using related process measurements rather than interpreting viscosity in isolation.
Illustrative engineering scenario
Consider a continuous solution polymerization reactor where outlet viscosity increases while reactor temperature remains relatively stable.
The first step is to examine density and conversion measurements for evidence of increasing polymer concentration. Engineers should then check solvent composition, feed conditions, bypass flow and sample temperature.
If these variables remain within their validated ranges, the soft-sensor molecular weight estimate can provide additional evidence. A subsequent GPC result can establish whether average molecular weight or molecular weight distribution has changed.
This diagnostic sequence separates process changes from measurement disturbances before corrective operating adjustments are made. It is an illustrative engineering example, not a reported DODGEN customer project.
Integrating State Estimation and Model Predictive Control
A 1999 study, Extended Kalman Filter-Based Nonlinear Model Predictive Control for a Continuous MMA Polymerization Reactor, demonstrated how online measurements can support molecular weight estimation and reactor control.
The researchers installed an online densitometer and viscometer in a continuous methyl methacrylate (MMA) polymerization system. Density measurements were used to calculate conversion, while viscosity measurements combined with conversion data were used to determine weight-average molecular weight.
An Extended Kalman Filter-based nonlinear model predictive controller was developed to control conversion and molecular weight. Its manipulated variables included jacket inlet temperature and feed flow rate.
The Extended Kalman Filter estimates reactor states by combining model predictions with available measurements. Model predictive control uses these estimates and a dynamic process model to determine operating adjustments within defined constraints.
The study demonstrates the integration of online measurement, state estimation and process control in a specific MMA system. Its results should not be generalized to polymerization systems with different reaction mechanisms without additional validation.
Linking Operating Variables to Product Quality
Depending on the polymerization mechanism, validated molecular weight estimates may support adjustments to
- Monomer feed rate.
- Initiator feed rate.
- Reaction temperature.
- Solvent or diluent feed.
- Residence time.
Each variable can influence reaction kinetics, heat removal, conversion and polymer chain development. For example, changing temperature can affect both reaction rate and chain termination behavior.
The direction and magnitude of these effects must be established through a suitable process model or experimental validation. Model predictive control is particularly relevant when multiple operating variables interact or measurement delays limit conventional feedback control.
Scale-Up Challenges for Online Polymerization Monitoring
A monitoring strategy developed in a laboratory or pilot reactor may not remain equally reliable in commercial production. Changes in mixing, heat transfer, flow behavior and sampling conditions can affect both polymerization behavior and measurement representativeness.
Laboratory-to-Pilot Validation
Laboratory experiments establish the initial relationship between viscosity, molecular weight and reaction conditions.
Pilot-scale validation must determine whether this relationship remains applicable under more representative operating conditions. Differences in temperature uniformity, shear history, polymer concentration and sample handling can influence measurement comparability.
The objective is to validate the complete measurement and estimation method, not merely confirm that the instrument produces a stable signal.
Pilot-to-Commercial Model Transfer
Commercial reactors may have different mixing characteristics, residence time distributions, temperature gradients and feed fluctuations from pilot systems.
These differences can change polymerization behavior and weaken correlations developed at smaller scales.
Before a pilot-scale model is used for commercial process decisions, validation should examine
- Agreement between online measurements and laboratory reference results.
- Model performance across commercial operating conditions.
- Sensitivity to changes in feed composition and temperature.
- Measurement consistency across sampling locations.
- Conditions outside the validated model range.
Model transfer should be based on commercial operating data rather than assuming that pilot-scale correlations remain valid without adjustment.
Fouling, Cleaning and Long-Term Measurement Stability
Polymer deposition can affect sensor surfaces, bypass lines, filters and analytical equipment. The risk is particularly relevant in high-concentration systems or processes that can produce gels and deposits.
Monitoring system design should address sensor accessibility, flushing arrangements, compatible cleaning procedures, measurement drift and maintenance requirements.
For bypass systems, cleaning must restore the sampling path to a reproducible condition. Residual polymer or solvent can affect subsequent measurements and produce misleading trends.
Long-term reliability therefore depends on the complete sampling and analytical arrangement rather than the sensor alone.
Integrating Monitoring Into Commercial Production
Industrial implementation requires coordination between process engineering, instrumentation, automation and analytical teams.
Sampling location, utility requirements, hazardous-area classification, communication protocols and maintenance access should be addressed during process design.
For continuous polymerization projects, monitoring requirements should be evaluated alongside reactor configuration, process equipment and scale-up validation. DODGEN’s polymerization reactor solutions and continuous flow reactor technology provide relevant equipment context when evaluating reactor and process integration requirements.
Selecting a Monitoring Strategy Based on Process Requirements
Technology selection should begin with the polymer properties that need to be measured and the frequency required for process decisions.
| Process requirement | Technology to evaluate | Engineering consideration |
|---|---|---|
| Continuous process viscosity tracking | Inline viscometer | Temperature, shear and installation conditions |
| Molecular weight trend estimation | Viscometry with a validated correlation | Polymer-specific calibration |
| Intrinsic viscosity monitoring | Capillary viscometry or suitable ACOMP configuration | Sample dilution and temperature control |
| Molecular weight distribution analysis | GPC/SEC | Calibration and separation resolution |
| Multi-parameter reaction monitoring | ACOMP | Detector configuration and sample conditioning |
| Estimation between direct measurements | Validated soft sensor | Model accuracy and operating range |
| Advanced process control | Integrated measurements and process models | Dynamic model reliability and control constraints |
Matching Technology to Polymerization Conditions
For homogeneous solution polymerization, online viscosity and density measurements can provide useful information about conversion and molecular weight when supported by an appropriate process model.
ACOMP is worth evaluating when the objective includes monitoring several reaction characteristics, such as conversion, composition drift, molecular weight evolution and intrinsic viscosity.
For systems requiring detailed molecular weight distribution information, GPC/SEC provides analytical capabilities that a single process viscosity measurement cannot replace.
Heterogeneous systems, including emulsion and suspension polymerization, require additional attention to particle behavior, phase separation and sample representativeness. The analytical configuration must be validated for the actual polymerization mechanism.
Choosing Between Average Molecular Weight and Distribution Monitoring
The required molecular weight information also determines the appropriate analytical method.
A stable (M_w) does not necessarily indicate an unchanged molecular weight distribution. Different distribution profiles can produce similar average values but different downstream processing behavior.
When product specifications primarily depend on an established average molecular weight range, a validated viscosity-based estimation model may provide useful process information.
When dispersity, distribution shape or bimodality affects product performance, GPC/SEC or another suitable distribution-sensitive analytical method is necessary.
Establishing a Practical Monitoring and Validation Plan
Before selecting equipment, engineers should define
- Which polymer properties require direct measurement and which can be estimated.
- Which process variables influence each measurement.
- Where sensors and sampling points should be installed.
- Which laboratory methods will provide reference measurements.
- How analytical data will be used in process optimization and control.
These decisions establish whether an inline viscometer is sufficient or whether an integrated analytical platform is required.
For commercial production, pilot validation should confirm both measurement reliability and the performance of the molecular weight estimation model under representative operating conditions.
Conclusion
Online viscosity and molecular weight monitoring provides continuous polymerization systems with information about process rheology and polymer property development. Inline viscometry supports frequent process measurements, while capillary intrinsic viscosity analysis, ACOMP, GPC/SEC and soft sensors provide different levels of molecular weight information.
The critical engineering requirement is to establish a validated relationship between measured signals and the polymer properties that determine product quality. Temperature, concentration, shear conditions, solvent composition, sampling representativeness and molecular weight distribution must be considered before viscosity data can support molecular weight estimation.
For industrial implementation, measurement technology must be integrated with reactor design, sample conditioning, analytical validation and process control. Pilot-scale testing then establishes whether laboratory correlations and monitoring arrangements remain applicable during commercial production.
DODGEN approaches continuous chemical manufacturing through process engineering, equipment integration and industrial scale-up. Evaluating polymerization monitoring requirements alongside reactor and process design helps establish a more reliable pathway from process development to commercial operation.
FAQs
Yes. Viscosity can support molecular weight estimation when a validated relationship exists for the specific polymer, solvent and operating conditions. Intrinsic viscosity and the Mark-Houwink equation provide a basis for estimating viscosity-average molecular weight. Estimating weight-average molecular weight requires an additional validated correlation.
Inline viscometry measures process fluid viscosity under operating conditions. ACOMP extracts and conditions a sample stream before combining multiple analytical measurements. Depending on detector configuration, ACOMP can provide information about conversion, intrinsic viscosity, molecular weight evolution and polymer composition.
The Mark-Houwink equation relates intrinsic viscosity to viscosity-average molecular weight through polymer-specific constants. These constants depend on polymer chemistry, solvent and temperature. Weight-average molecular weight cannot be obtained directly from this equation without an additional relationship accounting for molecular weight distribution.
Online viscosity monitoring can indicate changes in polymer solution or melt behavior, but a single viscosity measurement cannot determine the complete molecular weight distribution. GPC/SEC provides more detailed information about number-average molecular weight, weight-average molecular weight and dispersity.
Online GPC uses automated sampling to transfer polymer samples from the process to a chromatographic analysis system. Sample preparation, dilution, filtration, column separation and detector analysis must be coordinated. Column configuration and analytical cycle time determine its suitability for continuous process monitoring.
Online monitoring supplies measurements that support state estimation, deviation detection and operating adjustments. When combined with validated process models, viscosity and density measurements can help estimate conversion and molecular weight. These estimates can support feedback control and model predictive control.